– Ian Padley, Global Marketing Manager Tissue, BTG Group
We hear much about data and data related topic everywhere today: big data, industry 4.0, internet of things, factor of the future and so on. Data really is everywhere, and in tissue making too, use of data is a well-established tool in many enterprises. In this article, we will take a quick look at the role of data analytics in a tissue process context, i.e. how do we use data systems to run a more efficient or less costly tissue making operation.
Background
Data is generated when a process is measured and quantified. In tissue production, the primary goal is to create a sheet with the target properties set by the customer, within the cost constraints of the producer. In order to know if those targets are met, measurements must be taken and data recorded. When targets are met, it is most important to know what process conditions led to that success. Again, it is data, process data in this case, that supplies the answer.
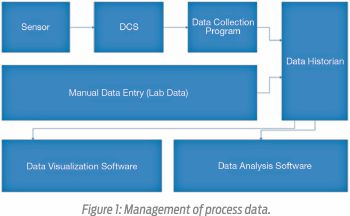
The management of process data can be broken down into three activities:
1. Data acquisition – the generation of data by a sensor or a laboratory technician
2. Data storage – the archiving of data in some form for future use
3. Data analysis – the recovery and use of past data to make decisions regarding future actions
 In the past, at the best producers product properties and major process settings were visually acquired and data storage involved placing those values onto written log sheets. Clearly, compared with modern systems, this can introduce a number of drawbacks. These include:
• The possibility of human effort in the transcription of the data
• The labor intensive nature of the manual data acquisition, leading to:
• Low frequency of data sampling, leaving no record of short term process upsets.
The paper-based log system presented even greater challenges when it came to the retrieval and analysis portion of data management. Even answering a very basic question, such as “What was the vacuum on that suction roll last time we ran grade X?” required manually going through all the logs to determine when grade X was run and then hand transferring and averaging enough readings to make a meaningful conclusion. More sophisticated enquires with multiple variables would take even longer to collate.
Once the condensed data was available, techniques such as graphing and statistical analysis could be applied. The difficulty involved in performing these types of studies meant that they were often not done due to time and manpower constraints. Instead of solid analysis, decisions were frequently made based on intuition and limited sets of data. Nevertheless, in terms of functionality, paper-based data management reliably allowed operations personnel to capture snapshots of good conditions in the past so that they could attempt to reproduce them in the future. Depending on the human resources available, log sheets also supported simple troubleshooting and process improvement efforts. Many tissuemakers still rely to this day on manual ‘centerline’ sheets.
The Rise of Digital Data
As in most other enterprises, the world of process data management shifted dramatically as data became digital. The transition started with the introduction of single-loop, microprocessor based controllers. Once process data existed as electronic digital values, it made sense to connect those controllers together so that multiple values could be displayed and manipulated from a single screen.
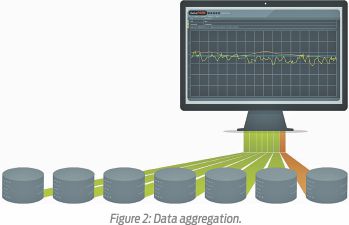 As the cost of digital storage media dropped, it was simple to record all incoming data and create an automatic electronic log, or database, of process values. There have been many different hardware and software platforms used to accomplish this. Each of the control system vendors promoted their own control systems and associated data historians, but as other parts of the mill (other process areas, accounting, and warehouses) became digitized, users wanted to be able to combine information from multiple systems and areas, a methodology known as data aggregation. For this reason, some of the best historian and analysis software packages were developed by third party vendors who were outside of the control system arena.
Modern data historians (the term for a data storage and retrieval system or database) allows operator access to high frequency data from all the sensors on the machine and in the process. A single point of data e.g. a consistency sensor readout or steam pressure readout is referred to as a ‘tag’ and there may be many thousands for a modern tissue machine.So, all the data is at hand, the challenge is to find and learn to use the software which allows the user to manipulate, analyze and finally get the most understanding of the ‘big data’ in the historian. Thanks to the modern computing power available to manipulate the data in the database, several powerful opportunities are presented by contemporary data management systems:
Graphical analysis
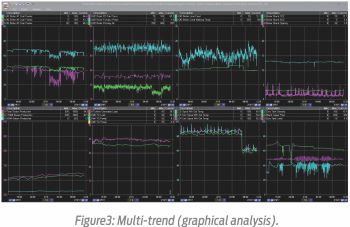 The most basic form of process understanding and improvement starts with simply being able to present real time data to operators and engineers. By way of contrast, for paper records, if a variable was drifting away from a target, and only being observed as a written number every hour or every other hour, it might have taken several observations or several hours before a problem was realized.Today, if that same variable is shown as a trend line updated every minute or second, the drift away from a target value can be noticed sooner and corrected in a much more timely manner.
Cost-based operating
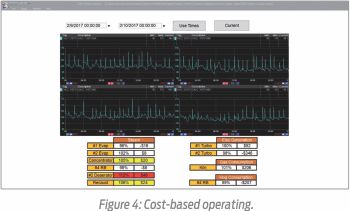 A good data management system should have access to values beyond those from a single process area. One approach to improving machine operations is to take cost data and integrate it with process data to create meaningful, dollar-based targets. Displaying a pseudo-variable of lost dollars or euros per hour determined by the difference between a grade-based target and an actual steam flow is more useful and meaningful to an operator than simply saying: “Try to keep the flow under X kilograms/hour”.
Centerlining
Many facilities depend on grade-based centerlines to successfully produce a range of products. Modern data management supports this effort in two ways:
• By enabling the display of centerline limits on a per variable and per grade basis
• Having access to large quantities of historical data makes it relatively easy to apply statistical methods to the process data to create meaningful and achievable limits.
Better Use of Data
So, a modern data management system permits faster and more efficient operational decision making. However, the computational power on offer may be harnessed in even more powerful ways:
Troubleshooting – helps you eliminate possible causes
By compressing the time scale of an event which is hard to spot even with a real time trend, for example a gradual drift out of spec of a key quality parameter such as MD tensile, the gradual deterioration becomes much more apparent as will an upstream variable which may be influencing it.
Even if nothing is indicated by this time compression exercise, provided we have logged and displayed all relevant process tags, we have at least eliminated these as potential causation. Thus we can then look at changes outside these trends, perhaps something as simple as the wrong chemical container being connected to the dosing line for the dry strength additive (DSA) in our above example. Whatever the outside influence is determined to be, the elimination of all of the online machine-related variables as suspects vastly speeds up the troubleshooting process.
Statistical analysis – proactive approach for best economy
Modern data management can also be used in a more proactive way to improve the economic performance of a process, including tissue making. We have already seem how center lining and trending can help improve day to day operational decision making, but there is always still some fluctuation in process variable, and hence a range of product outcomes.
This is where we can use statistical packages built into the software to determine the most significant relationships. Returning to our MD tensile example, a mill might believe that their best leverage on MD strength is a costly DSA, whereas statistical analysis of past data might indicate that an operational variable such as refining intensity can have a similar level of control, with considerably less cost.
Statistical modelling – correlation to “standard” variables
More sophisticated still is the use multivariate analysis, a statistical tool readily applied in data management system. Typically, we use this to model the behavior of one difficult to measure variable based upon the statistical analysis and correlation of another set of variables. This could, for example, be a quality parameter only lab measured once per reel, but we can predict its behavior in real time by looking at the multiple process variables which may influence it, like efflux ratio, furnish mix, refiner power, crepe ratio, drying and so on.
Soft sensors
If we take this to its full conclusion, we create what is called a ‘soft sensor’ or calculated virtual output variable. This is an accepted methodology used, for example, to track effluent quality once the mathematical model has been established.
The use of soft sensors presents an opportunity to show tangible economic returns. The ability to observe a virtual quality parameter drifting off-spec in mid-reel can perhaps mean that only a single reel needs to be culled, assuming the problem is rapidly rectified. The delay incurred by the traditional method of completing the reel, taking a sample, and getting results back from lab, and the accompanying production of additional off-spec product while this occurs, is avoided by the use of a soft sensor. This increase in productivity, and the associated economic savings, based on the soft sensor is therefore easily documented.
Summary
There is no doubt that the effective use of modern data management systems gives progressive tissue producers a competitive edge. The ability of a data system to manage the process with increased accuracy, precision and reproducibility removes much of the black art or intuition previously prevalent in tissue making. Troubleshooting process or tissue machine output upsets becomes far faster and more effective. Additionally, statistical modelling and soft sensor concepts will yield even higher economic benefits to the tissue maker in terms of improved quality, higher productivity and lower raw material costs and wastage. From the point of view of both bottom line profit and future sustainability, data has a very bright future in tissue making.
(This article was adapted by the writer from a longer and more detailed piece by Jay Sheldorf available to view on Tissue Story, www.tissuestory.com. The article was also published in World Pulp & Paper 2017.)