
By Cathy Greenleaf, Senior Consultant, Fisher International
| Typical Phases of Industry Growth | |
| PHASE | CHARACTERISTICS |
| Start Up | Innovative product; entry to market not as difficult |
| Growth | Generally during this phase smaller companies are forced out through consolidation and barriers to entry are high |
| Mature | Profit margins are lowered; market share and cash flow are the primary goals with minimal reinvestment- cash to shareholders; fewer, more dominant companies |
| Decline | Revenue declines; capacity exceeds demand, weak competitors withdraw, attracts investors as industry is gradually run down and milked for cash; M&A is the norm |
While the first U.S. paper mill may have started operations way back in 1690 (in Pennsylvania), the industry as we know it today is still not as old and mature as many people believe it to be. It’s an important question because industries behave differently depending on how mature they are. It’s useful to know where a business is in its evolution when thinking about your company’s strategy, whether for investing, developing new products, or planning how much to invest in sales and marketing. There’s academic support for looking at industries in terms of their stages of development. Let’s take a look at where the U.S. industry is today against the four stages of industry growth as outlined in the sidebar.
Technology is usually a principle driver of an industry’s development – think the steam engine in the 19th century, computer chips in the late 20th century and digital communications in the 21st century. Seminal new technologies stimulate investment in new production capacity and in more technology development. This, in turn, causes new companies to rise and others to fail. So, one important measure of an industry’s development stage is how much and how fast technology is changing. Which phase is the U.S. paper industry in now?
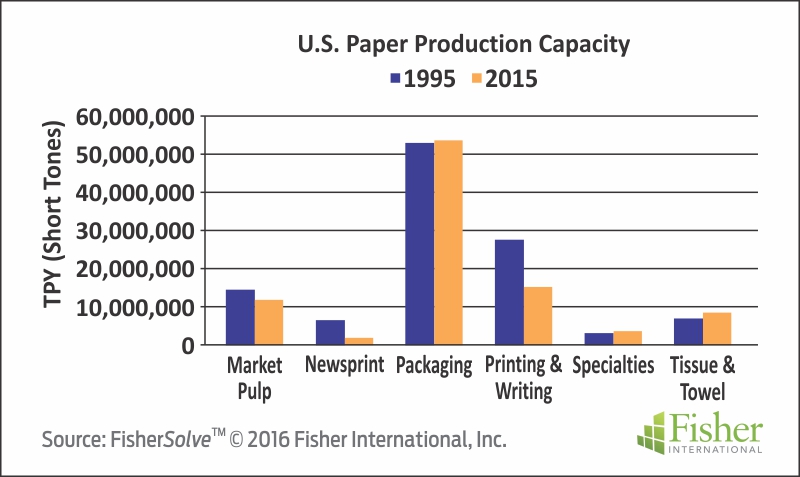
As a whole, the U.S. paper industry peaked at the turn of the twenty-first century and the changes since then have been significant. In the past twenty years, almost 18 million tons (16%) of paper production has come off-line in the U.S. In 1995, there were 215 companies with 1,257 machines having capacity of 114 million tons of paper. Today, there are 125 companies with 689 machines having capacity of 95.9 million tons. But the reduction in capacity has by no means been distributed evenly across all grades or all areas of the country. A close look will show that not all grades are at the same stage of development.
As everyone knows, Newsprint and Printing and Writing have declined dramatically over the past twenty years (Figure 1). Newsprint machine design hasn’t changed much since the gap former was introduced 50 years ago. And while there have been many interesting and useful modifications made to Printing and Writing manufacturing in the last several decades, the pace of major changes has been quite slow. So it would not be surprising to find that Newsprint and Printing and Writing grades behave more like industries in the third or fourth stage of development. And, in fact, profit margins are thin, M&A activity has concentrated ownership of production, demand is declining, and bankruptcies have claimed many a shareholder’s equity. Classic fourth-phase behavior.
Capacity Change by Grade
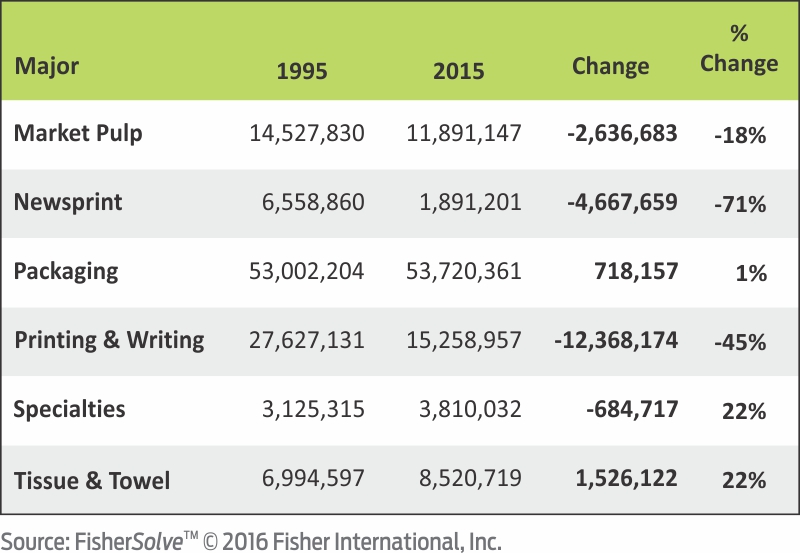
Packaging, Specialties, and Tissue and Towel have grown or remained flat (Figure 2).Packaging, the largest paper segment in the U.S., has been essentially flat for the last twenty years with cycles causing it to grow and contract in the short-term. Major consumers, such as U.S. automotive parts manufacturers, moved offshore in those two decades. However, the economy and population grew and e-commerce grew faster providing a positive capacity trend. So demand, while not growing much, is stronger than in communication papers.
Technology, however, as in the case of communication papers, has not had any seminal developments. As a result, the packaging sector behaves like a classic phase three segment: while companies are making money, margin growth has flattened, M&A is consolidating production, and cash flow is a principle driver of decision-making.
Now let’s look at Tissue and Towel. Demand growth is flat overall. However, the situation with technology is quite different. There have been fundamental changes in the way tissue is produced. TAD, developed and introduced by P&G in the 1970s and 1980s, revolutionized tissue product characteristics and gave P&G a sustainable proprietary advantage. K-C and G-P responded with technology development of their own. The expiration of the TAD patents in the last 10 years made the technology available to other tissue producers. It also stimulated another round of technology development. Voith introduced its ATMOS process and Valmet its NTT process, both offering ways to create a structured sheet that changes the end-user experience.
The new product qualities becoming available at lower prices have started big shifts in demand from lower-quality products towards higher quality ones. The turbulence has given rise to new companies, such as First Quality, and contributed to the fragmentation of the segment. Driven by technology change, it is not surprising to see Tissue and Towel segment behavior like that of the first or second stage of industrial development: M&A has not yet had a big impact on the sector because valuations are relatively robust and companies would rather grow organically than through acquisition. Customers willing to spend capital cause suppliers to invest in new technology, creating a virtuous cycle of development.
Investment and Reinvestment
We can see the results of the different stages of development in the facts.
New Machines
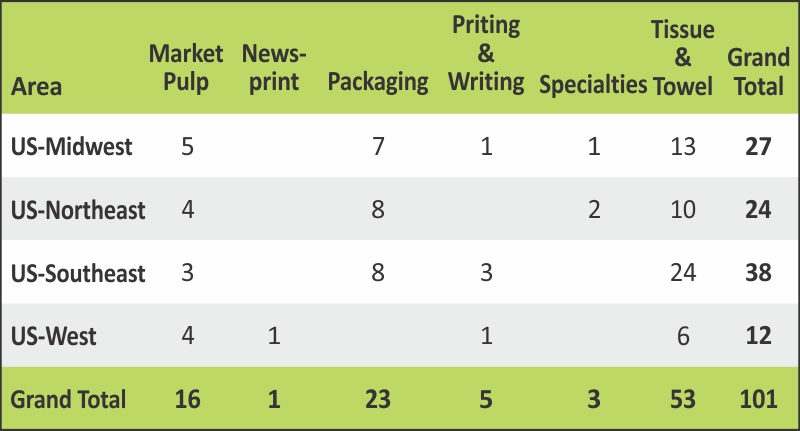
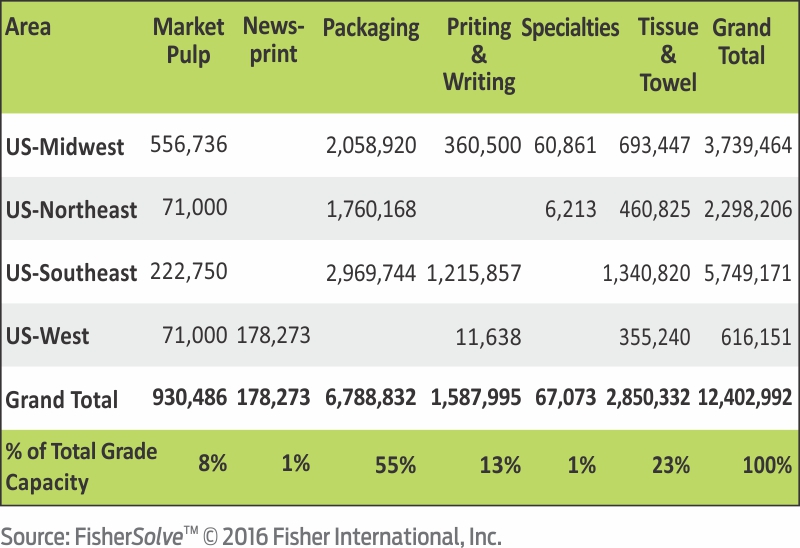
While there has been an overall decline in tons produced in the U.S., there have been 101 new machines built since 1995 across all grades (13 of which have been idled since being built. Figure 3a provides an indication of where investments have been made. New-build investments in the southern area of the U.S. have far outpaced that of any other area, with Tissue and Towel machines being predominant across all areas. New Tissue and Towel machines that are still operating represent 13% of 2015 total capacity (Figure 3b).
New Paper Machines 1998-2015
2015 Tons on Machines 1995-2015
New Machines 1995-2015 Now Idled or Dismantled
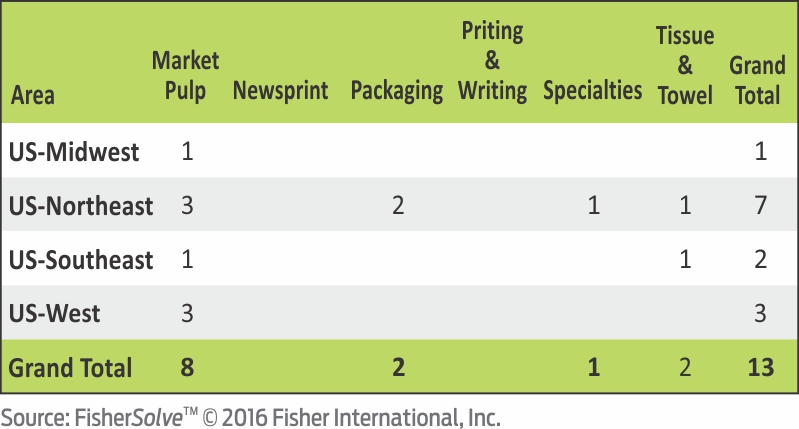
As Figure 4 shows, 13 machines built in this timeframe have since been idled with the Northeast losing half of all the new machines idled or 29% of the new machines built in the region.
Upgrades and Conversions
U.S. reinvestment in paper machines has been notable by its relative absence during the past twenty years (Figure 5). Of the 689 machines operating in 2015, only 327 have received upgrades or been converted during that timeframe. (Actually, a total of 456 machines received upgrades or underwent conversion, but as many as 133 of them have since been shut down or dismantled; one is in the ‘restart’ mode.)
Machines Upgraded 1995-2015
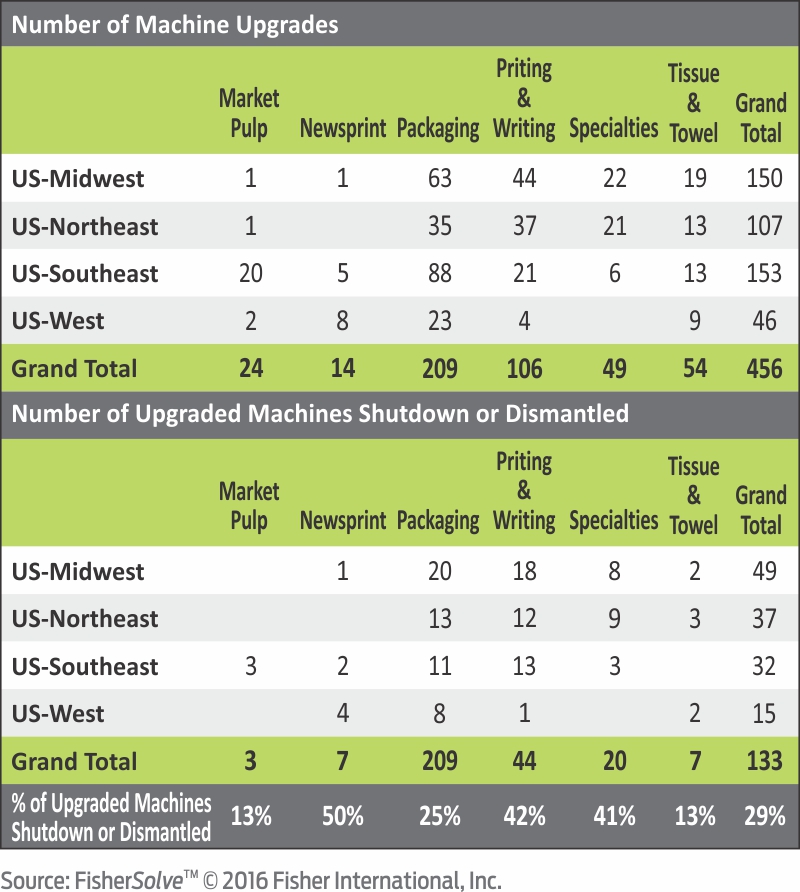
The machines receiving the most upgrades/conversions are those now producing Packaging grades. Over 40% of the machines in Graphics grades that received upgrades likely did not recoup their investment as they have since been idled.
What areas of the country fared best?
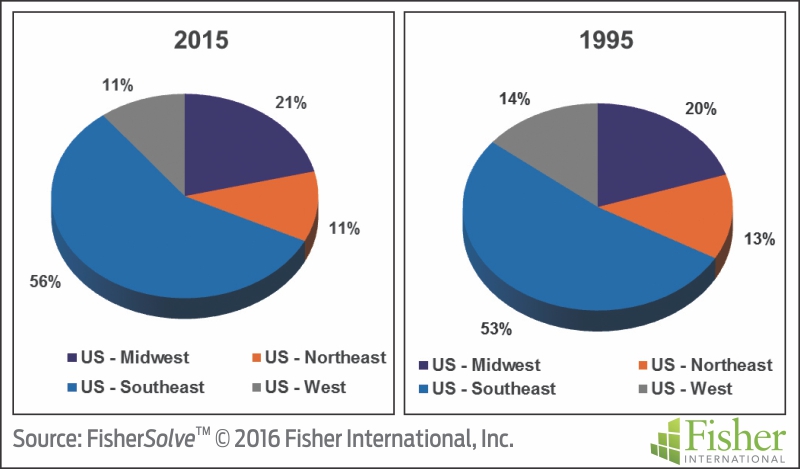
Big evolutionary changes to industrial sectors can have an impact not only overall, but also in the regions that host their production. While all areas of the U.S. have decreased in overall tons produced since 1995 (Figure 8), the Midwest and Southeast have increased share positions at the expense of the Northeast and West (Figure 6). The drivers behind this phenomenon vary by grade and area: the shift in market shares can generally be attributed to the concentration of growing vs. declining grades in each region.
U.S. Production Capacity Share by Area
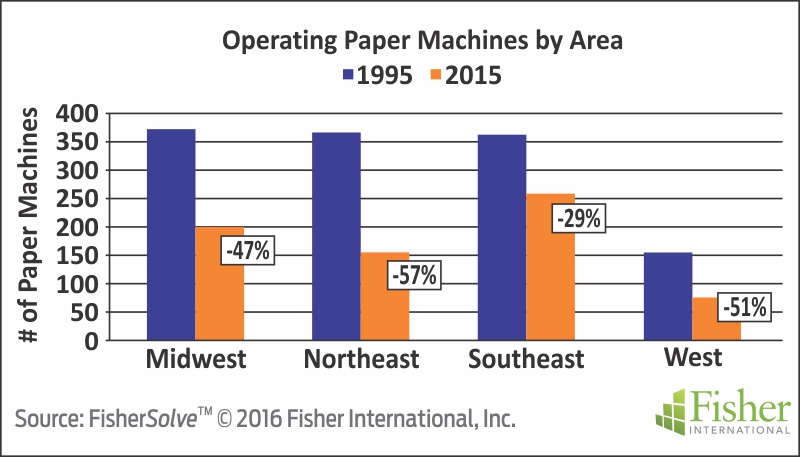
This shift is further evidenced when comparing the number of operating paper machines in 1995 versus 2015 in Figure 7.
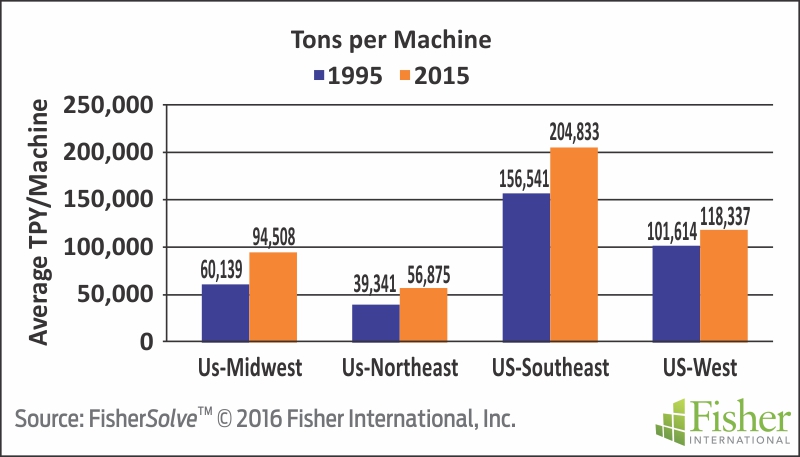
Despite declines in production volume within each region and the overall reduction in the number of operating machines, those machines that are operating in 2015 tend to be larger, with capacity rates averaging about 45% higher than the machines that were operating in 1995 (Figure 8).
It’s easier to interpret the events and changes we see in the marketplace every day if we keep in mind larger patterns and trends that drive them. Fisher’s models suggest how patterns we’ve seen in the past twenty years will evolve and how they’ll affect producers and their suppliers. For example, we anticipate that 60 or so machines making 2.3 million tons have a serious chance of closing or, at the very least, changing grades within the next 5 years. Those machines will affect $260 million per year in total spend on materials, chemicals, and fiber. At the same time, Tissue and perhaps Packaging will see new entrants, realignment of competitive positions, more new technology development, and other characteristics of earlier stages of industrial development.
Fisher International is a consulting firm that supports the global pulp and paper industry with business intelligence and data-driven strategy consulting. The information and analyses for this article are drawn from FisherSolve™, the industry’s premier market intelligence database and analytics resource.