
By Subhash Deodhar,
Senior Consultant, Fisher International
Paper mills are fairly large consumers of thermal and electrical energy. Thermal energy is used mostly to dry paper by way of steam. Efficient use of energy is certainly an integral part of good paper mill operation. Greenhouse gas emissions (GHG) are closely linked to overall energy usage, but also depend upon types of fuels used. This paper compares energy usage and GHG emissions at paper mills in India with those in other major paper producer countries.
The analysis is based on data in Fisher International’s FisherSolve™ database. Fisher International maintains a comprehensive database of paper mills across the globe producing more than 50 tons of paper per day. The FisherSolve database contains detailed process-equipment and production data for more than 300 paper mills in India that fit the size classification. The total number of paper mills in India may be close to 800, but the rest are very small and, consequently, have minor economic impact. Nevertheless, small paper mills are likely to be less energy efficient, and thus will have a greater opportunity and incentive for improvement.
The grade of paper manufactured dictates overall energy usage. Another major factor is the source of pulp. Pulp may come from an integrated virgin pulp mill or it may come from a wastepaper recycling operation. In some instances the mill may be buying pulp from a market pulp mill located anywhere in the world. So any valid comparison has to be made between mills making similar grades and having similar pulp source.
Types of mills selected for comparison:
- Packaging grade mills using recycled pulp. 160 of 191 packaging grade mill sites in India rely completely on recycled pulp, these mills account for about 80% of packaging grade production. Packaging grades include Linerboard, Corrugating Medium, Boxboard, Chipboard, Bag and Sack paper, Tube and Core paper, and Wrapping paper.
- Printing and Writing grades using virgin pulp in integrated mills. 19 out of 98 P&W grade mill sites in India are virgin integrated and account for about 36% of P&W grade production. (Newsprint is not included in P&W grades.)
- Printing and Writing grades using recycled only pulp. 63 out of 98 P&W grade mill sites are recycled pulp only and account for about 32% of P&W grade production. (Newsprint is not included in P&W grades.)
- Newsprint mills using recycled only pulp. 47 out of 52 Newsprint grade mill sites in India are based on recycled pulp only and account for about 90% of Newsprint production.
Packaging grade mills using recycled pulp:
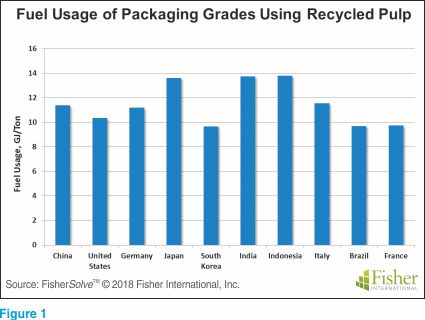
There are 1400 mills worldwide in this category. The top ten producer countries account for more than 75% of the production, India’s 160 mills combined rank 6th by production volume. Fuel usage per ton of paper for each of the top ten producer countries is in Figure 1. (Countries on the X-axis from left to right are in decreasing order of production volume.)
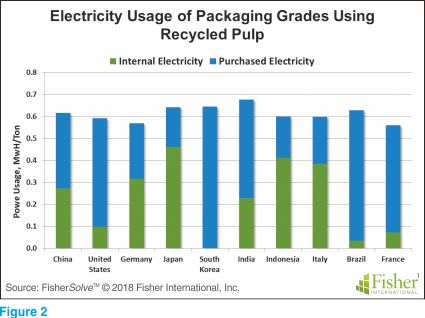
A large number of paper mills have CHP or Combined Heat and Power units. Since steam is needed to dry the paper, most paper mills generate electricity before using the steam. Electricity usage – internal and purchased for this group of mills is shown in Figure 2. Japan, Indonesia and Italy have a much higher percentage of electricity coming from internal sources as compared to India. China’s percentage is also a little higher than India.
GHG or Green House Gas emissions are classified as Scope 1 and Scope 2. Scope 1 emission is from combustion of fossil fuels at the mill site. The type of fuel used has some effect on the emission level. Coal and Natural gas are the most common types of fossil fuels used in paper mills. CO2 emission form combustion of natural gas is at least 40% less than that from combustion of coal for the equivalent energy output. CO2 emission from combustion of Biomass fuels is not counted as GHG emission. CO2 is absorbed during growth of biomass, thus biomass fuels are considered carbon neutral. Scope 2 emission is for purchased electricity, it is emission from combustion of fossil fuels where purchased electricity is generated. Emission factors for electricity generation by country compiled by IEA (International Energy Agency) have been used in calculating Scope 2 emission.
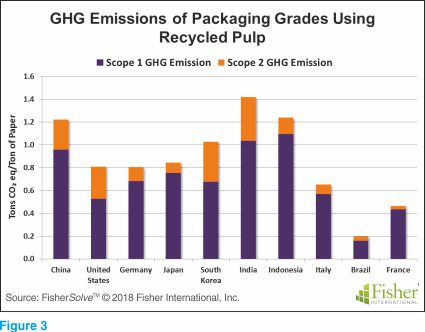
Scope 1 and Scope 2 emissions intensity values for Packaging grades by country are in Figure 3. Coal is the primary fuel for paper mills in China, India and Indonesia. Biomass fuels are used extensively in Brazil, thus the very low number for Brazil’s Scope 1 emission intensity. Scope 2 emission intensity depends on purchased electricity usage and on emission factor for the country. France and Brazil have low scope 2 country emission factors. Nuclear plants are major sources of electricity in France, whereas hydroelectric is a major source for electricity generation in Brazil.
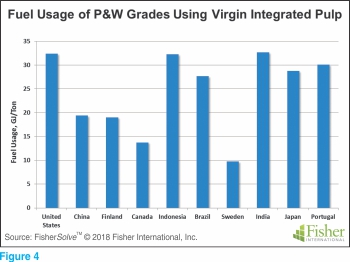
Printing and Writing grades using virgin pulp in integrated mills
There are 179 mills worldwide in this category. The top ten producer countries account for more than 75% of the production, India’s 19 mills combined rank 8th by production volume. Fuel usage per ton of paper for the top ten producer countries is in Figure 4. Printing and Writing grades in this group do not include Newsprint. Mechanical pulp production generally requires less fuel but more electricity. That is evident in fuel and electricity usage for Canada and Sweden. The grade mix for both countries has a large proportion of mechanical-pulp-containing grades.
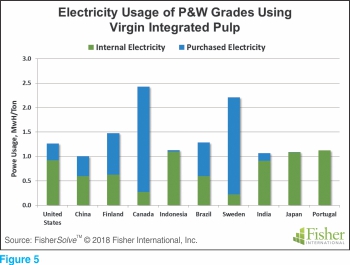
Electricity usage – internal and purchased electricity – for this group of mills is shown in Figure 5. The grade mix for mills in Japan and Portugal are mostly woodfree P&W grades and mills are self-sufficient in electricity. Paper mills in India for this group are also doing well for power self-sufficiency.
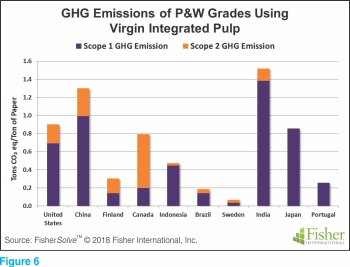
Figure 6 shows Scope 1 and Scope 2 emissions intensity for Printing and Writing grades by country. Japanese and Portuguese mills in this category have virtually no Scope 2 emission since they are almost entirely power self-sufficient.
Printing and Writing grades using recycled only pulp
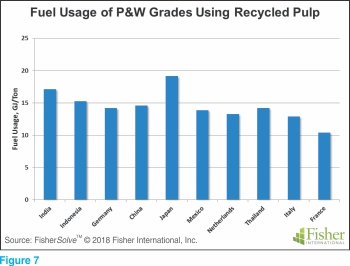
There are 183 mills worldwide in this category. The top ten producer countries account for about 75% of the production, India’s 63 mills combined rank 1st by production volume in this group. Figure 7 shows fuel usage per ton of paper for each of the top ten producer countries. Printing and Writing grades in this group do not include Newsprint.
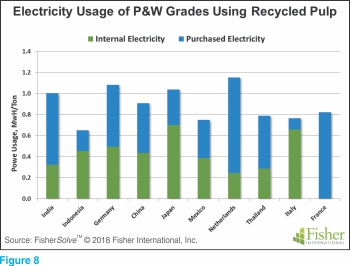
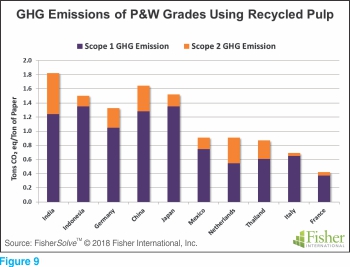
Electricity usage – internal and purchased – for this group of mills is shown in Figure 8. Power self-sufficiency is very high for mills in Japan, Indonesia and Italy. Scope 1 and Scope 2 emissions intensity for Printing and Writing grades by country are Figure 9. Coal is the dominant fuel for mills in India, Indonesia and China. Coal usage is also very high for German mills. Fuel oil is very common in Japan while natural gas is the primary fuel for mills in Italy, Mexico, Thailand and The Netherlands.
Newsprint mills using recycled only pulp
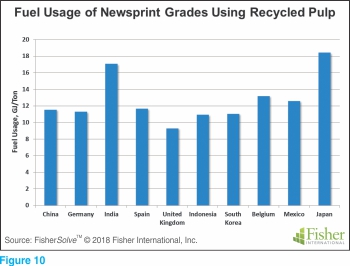
There are 99 mills worldwide in this category. The top ten producer countries account for about 85% of the production, India’s 47 mills combined rank 3rd by production volume in this group. Fuel usage per ton of paper for each of the top ten producer countries is shown in Figure 10.
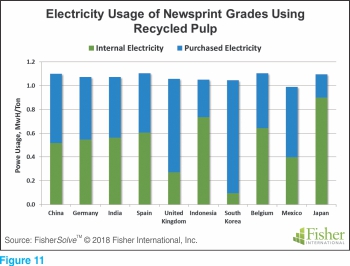
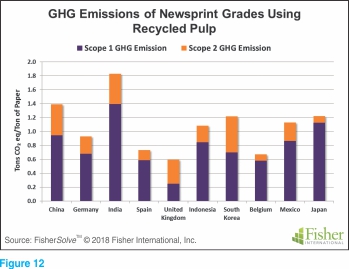
Electricity usage – internal and purchased electricity – for this group of mills is outlined in Figure 11. Power self-sufficiency is highest for mills in Indonesia and Japan. Scope 1 and Scope 2 emissions intensity for Newsprint grades by country are in Figure 12.
All Packaging, Printing and Writing, and Newsprint grades combined
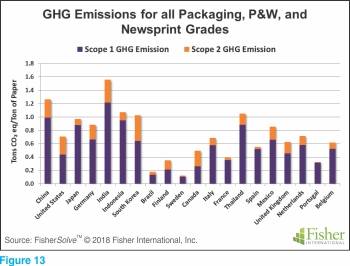
It is beneficial to look at energy, fuels and GHG scenarios for the major paper producing countries. The following graphs roll up the data for all Packaging, Printing and Writing, and Newsprint grades by country. We do not include Tissue and Towel grades because Tissue and Towel production is very small in India as compared to major T&T producer countries, thus the exclusion. Scope 1 and Scope 2 emissions by country are shown in Figure 13. The type of fuel used has significant impact on Scope 1 emission.
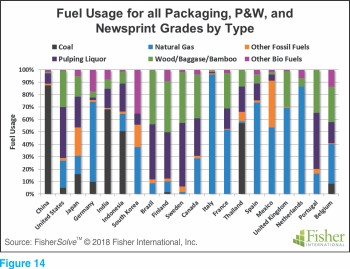
Figure 14 reveals fuel usage by percentage of fuel types for the top twenty producing country. In both graphs, countries are listed left-to-right in descending order of production. The correlation between high GHG emission and coal usage is made clear in a comparison of these two graphs.
Fossil fuels include Coal, Natural gas, and other fossil fuels such as Fuel oil (no. 2 and no. 6), Petcoke and Tires. CO2 emission from all fossil fuels is what determines scope 1 GHG emission. Pulping liquor, wood/bagasse/bamboo, along with other biofuels are biomass fuels and considered carbon neutral. CO2 emission from biomass fuels is not counted toward Scope 1 GHG emission. Other biomass fuels include Biogas, Biodiesel, Sludge from wastewater treatment, Agricultural waste and Municipal waste.
Coal is the primary fuel in China, India and Indonesia. Natural gas is a major fuel source in Germany, France, Italy, Mexico, Spain, Thailand, The United Kingdom and The Netherlands. Biomass fuels usage is greater than 50% in United States, Brazil, Finland, Sweden, Canada and Portugal.
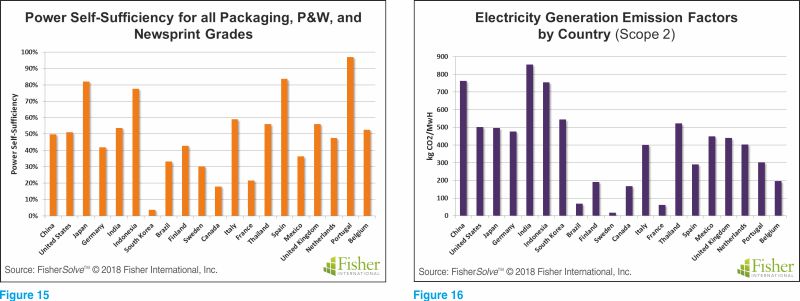
Scope 2 emission values are impacted by power self-sufficiency and purchased electricity emission factors for each producing country as represented in Figures 15 and 16 respectively. Most countries’ producers have power self-sufficiency in the range of 40% to 60%, which is a good position. Countries that are doing even better are Japan, Indonesia, Spain and Portugal.
Combustion of fossil fuels to generate electricity is the only mode of power generation that contributes to the GHG emission factor in Scope 2 calculation. Hydroelectric, Wind, Solar and Nuclear do not contribute to GHG emission and thus to emission factor. Combustion of biomass fuels to generate electricity is also not counted in GHG Scope 2 emissions. Brazil and Canada rely on hydroelectric, France is heavily dependent on Nuclear, but China, India and Indonesia rely on combustion of coal as their major mode of power generation. Conversely, Sweden gets less than 2% of its electricity from combustion of fossil fuels; the remaining 98% comes from combination of all other modes.
Scope 2 emission factors generally decrease over the years for most countries. Increase in renewable sources of energy is obviously the main reason. Power generation from wind and solar is on the rise. Use of renewable or biomass fuels is also increasing. There is also a modest increase in nuclear power plants. Hydroelectric power plants have been in use for a long time and their possibilities have reached a peak in most developed countries.
Observations and conclusions
India is a major paper producer in the world except for Tissue and Towel grades. Since the papermaking process and technology is uniform all over the world, benchmarking against similar paper mills in other countries helps in identifying areas of opportunity. Most paper mills in India have significant potential for improvement in their energy efficiency. Various small and large initiatives to reduce energy usage have been identified and implemented over the years by papermakers all over the world.
Cogeneration is a win-win option from every angle. Reduction in GHG emission is good for the earth, but it can also be good for the paper mill’s bottom line if the results come via improvement in energy efficiency. Coal will remain the dominant fuel in India, but it is worthwhile looking at alternate biomass fuels. Most biomass fuels can be burned in coal fired boilers.

Fisher International is a consulting firm that supports the global pulp and paper industry with business intelligence and data-driven strategy consulting. The information and analyses for this article are drawn from FisherSolve™, the industry’s premier market intelligence database and analytics resource. To learn more, please visit www.fisheri.com. Subhash Deodhar can be reached at sdeodhar@fisheri.com.