
By Neo Wu, Senior Consultant, Fisher International
Over the past two to three years, China has announced tens of million tons of new containerboard capacity which makes people wonder: as a regional containerboard producer, can China really consume all this new capacity? Is this a signal of overcapacity? How will the future containerboard price behave?
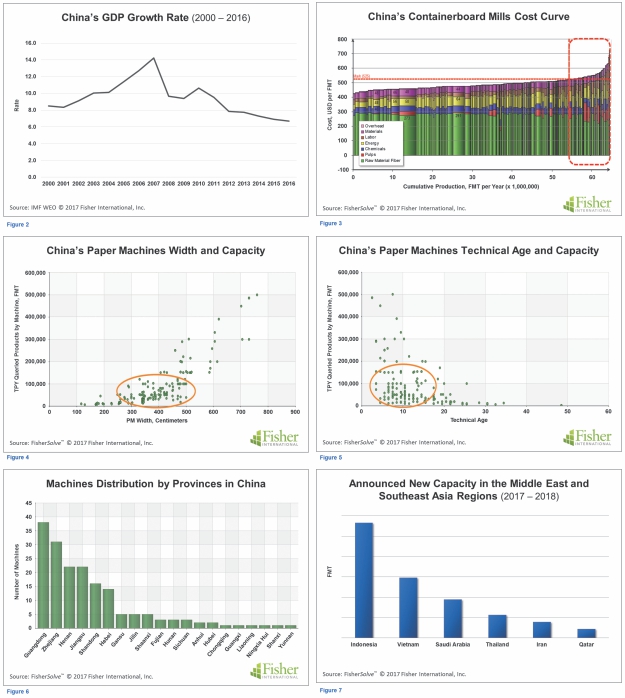
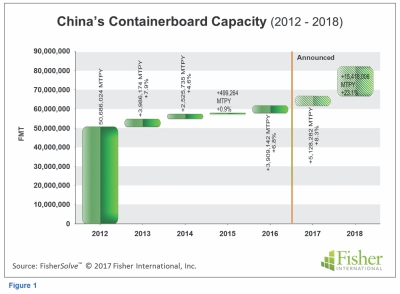 Figure 1 shows historic and announced new containerboard capacity in China from 2012 to 2018, indicating that China will experience nearly 20 million tons of new containerboard capacity in just the next two years if all the new capacity is installed. The percent growth that represents is very significant, especially considering that GDP growth in China has fallen to less than 6.5% (Figure 2).
If we accept that 6.5% is a reasonable GDP growth rate for China for the next few years, we would expect about 65 million tons of operating containerboard capacity by 2018 to meet the market demand, which may result in more than 10 million tons of excess capacity in the market.
Since late 2016, paper prices in China have experienced significant growth, making most paper producers, especially containerboard producers, extremely profitable. Prices grew because of the confluence of three factors: inventories had trended down, investment in new capacity had been low (see the year 2015 in Figure 1), and demand grew. These made the supply-demand balance tight. We see the result in the spate of new capacity announced for 2018.
A secondary effect of the large amount of new containerboard capacity to be pumped into China will be some consolidation of the market. The new capacity will be low cost and, together with government pressure, will eventually force marginal producers to close, leaving larger producers with a greater share of market. We expect over 10 million tons of containerboard capacity to be retired in China over the next three years.
There will be another follow-on effect of new capacity and consolidation: a change in the long-term price of containerboard. Figure 3 shows the cost curve of all containerboard mills in China. Once the market retires the highest-cost 10 million tons of capacity, those in the red boxed area at the right of the cost curve will mostly be eliminated.
The marginal producers’ costs, therefore, will be those that are now in the third quartile which is already in the flat part of the cost curve. Once the cost curve gets that flat, whenever the market price falls to the floor, no producer will make much profit. Conditions like that typically stimulate M&A activity which would further consolidate the market. We can look forward to a changing containerboard market structure in China.
Figures 4 and 5 reveal that a majority of the paper machines in those riskier mills average 100,000 MT per year of capacity, run at speeds of around 400 MPM, and have a technical age below 20 years – fairly young.
Figure 6 reveals the location of these machines, indicating that Guangdong and Zhejiang provinces hold most of them. Will these machines be sold elsewhere second hand (whether in their entirety or as key components) to other developing countries?
Figure 7 shows the announced capacity addition in Southeast Asia and the Middle East regions which total over 2.5 million tons.
Through the Chinese government’s “one belt one road initiative”, there is a golden opportunity for equipment suppliers, trading partners, as well as financial institutions to work together and create this new business model.
 Fisher International is a consulting firm that supports the global pulp and paper industry with business intelligence and data-driven strategy consulting. The information and analyses for this article are drawn from FisherSolve™, the industry’s premier market intelligence database and analytics resource. To learn more, please visit www.fisheri.com. Neo Wu can be reached at zwu@fisheri.com.