
BTG’s online Kappa analyzer at Green Bay Packaging’s Arkansas Kraft Division permits Kappa number and pulp yield increases plus improved runnability on the containerboard machines.
Mark Williamson, Journalist Engineer

Papermakers in an integrated kraft containerboard mill know very well they have to adapt their papermaking operations to compensate for incoming variations in Kappa number. Usually, with manual Kappa testing, they adjust refining levels and machine speeds to react to changes in drainage and drying rates to avoid web breaks and to maintain strength tests. However, with some inherent human variability in testing and time delays of over two hours, machine tenders are always playing catch-up and reacting to old tests with some extra testing variability that is built in. Machine runnability can suffer.
Green Bay Packaging’s integrated kraft pulp and containerboard mill in Morrilton, Arkansas, has found a solution to this dilemma by investing in a BTG Single Point Kappa Analyzer (SPK-5500). This analyzer serves a unique function since both pulp mill and paper mill operators value it and rely on it to stabilize their operations and quality. It is difficult to think of another measurement that has that this double impact. As a result, pulp mill operators have become better at controlling Kappa and have stabilized and increased its level and the pulp yield. Moreover, the papermakers have adapted the operation of their machines based on real-time information. The result is a good ROI on both sides of the mill. The fiber line with five batch digesters feeds two board machines that currently produce 1331 tons per day of linerboard and corrugating medium.
Delays impact fiber quality and runnability
The mill’s reasoning for the initial trial installation is explained in the internal justification document: “Because of the small sample size and frequency of the test, there is not enough information to react in real-time to variations in chip supply or the cooking process. These tests are performed manually every two hours by the pulp mill lab operator and take about an hour to complete. This delay in feedback of what the process is actually doing has proven to have a negative impact on fiber quality and board machine runnability. Based on the need for more accurate and real-time information, a trial Single Point Kappa (SPK) analyzer was installed during the May 2014 annual outage in the pulp mill. The SPK analyzer automatically takes multiple online samples (12 per hour), which provide a continuous feedback of the Kappa number.”
Jack Williamson, former pulp mill superintendent, now operations manager at the Green Bay Packaging Wisconsin mill, explains the previous dilemma for the pulp mill and downstream machine crews: “The manual tests were subjective and varied from tester to tester and shift to shift. The online measurement would remove the testing subjectivity and help us to improve runnability and keep the machine speed up. With high Kappa we would run into refining limitations and problems with strength tests. With low Kappa we had to reduce machine speeds.” Sean Lee, pulp mill superintendent, adds: “One snapshot every two hours is not a good indication of variation. The swings really give the paper makers problems.”
Williamson recalls additional reasons for their decision to purchase the SPK: “We wanted to avoid remote sample transport lines that could plug and would be more difficult to maintain.
BTG was well known to us and we had good experience with their consistency measurements in the pulp mill and paper mill. The lower cost of the SPK was also a factor.”
Simple, direct measurement
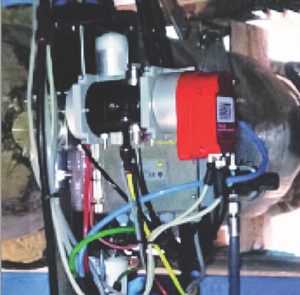
Unlike multi-point Kappa analyzers that are used typically in bleached kraft pulp mills, the SPK-5500 is purposely designed for a single point online measurement that is particularly suited to unbleached kraft pulp mills. The analyzer provides an accurate on-the-spot reading in a few minutes and there is no need for the additional delays and complexity of remote sampling devices, valves and sample transport lines to a central analysis unit. The SPK is mounted directly in the process flow and performs all the necessary operations for sample measurement including screening, washing and measurement of the pulp fiber lignin content using absorption of ultra-violet light. It is a simple and direct measurement with an improved sampling frequency of 10 to 12 samples per hour with the SPK compared to 2 or 3 samples per hour with the multipoint analyzer.
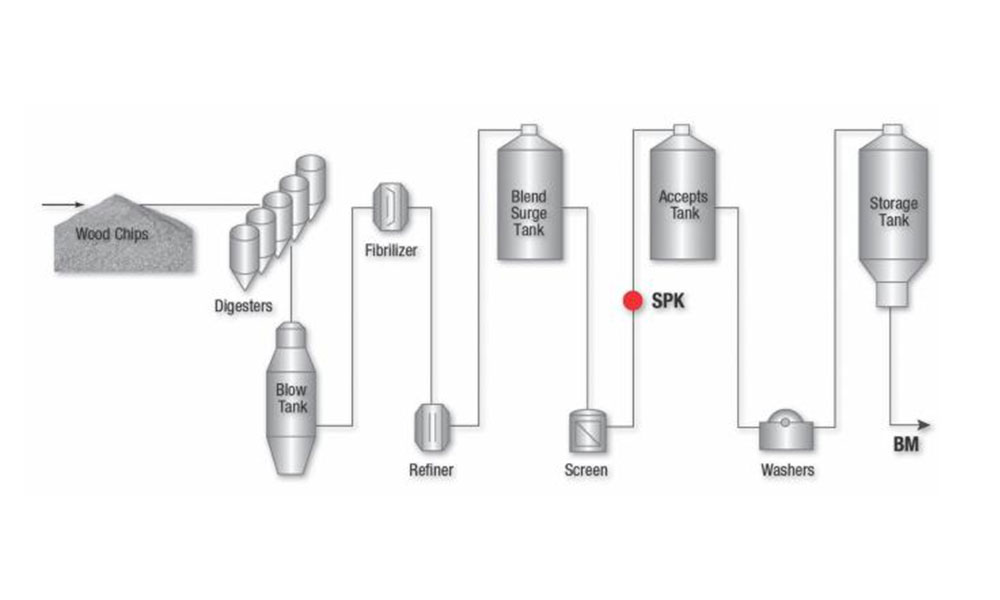
Figure 1 shows that the SPK analyzer is installed at the inlet of the screen accepts tank after the hot refining and screening. At this location the analyzer shows trends in the blow Kappa numbers from the digesters. With the frequent sampling Lee says it is possible for the operators to determine which digester the pulp is coming from since the interval between blows of the five digesters averages 2.25 hrs. The first signs of an incoming blow are recognized by the meter after about 15 to 20 minutes process delay, and the blow progress is followed thereafter.
Avoids over-control
The SPK measurement was evaluated over a five month period in 2014. The advantages of a quick measurement update are shown in Figure 3 which clearly indicates that the SPK has avoided the two hour delay with the manual tests. At that point in time the operators were making downward machine speed adjustments for lower Kappa number but the data was two hours old. The same is true for the speed resumption period.
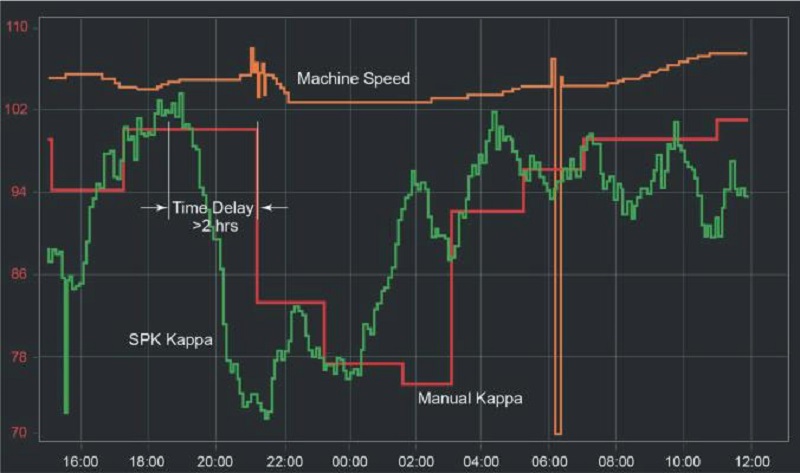
Figure 4 shows how the manual and the online Kappa number variation (sigma) decreased over time as the pulp mill operators became more familiar with the measurement and how to control the cooking process. The variation of data in Figure 4 shows a consistent gap between manual tests and online measurements although both decreased as the pulp uniformity became better. That gap between manual and online tests implies that the extra human testing variability was inherent in the manual tests. Since the operators now use the online measurement the extra variability of the manual tests is not a factor now. Lee confirms that the SPK numbers are an accurate tool for evaluating pulping process performance: “I have recently started using the K# average and standard deviation of the SPK as the indication of how we are running compared to our yearly goals and I have discontinued using the manual test numbers,” he says. Recent data provided by Lee shows that the average online measurement sigmas for six months up to January, 2016 were 2.63. That is better than 50% reduction from the initial trial numbers.
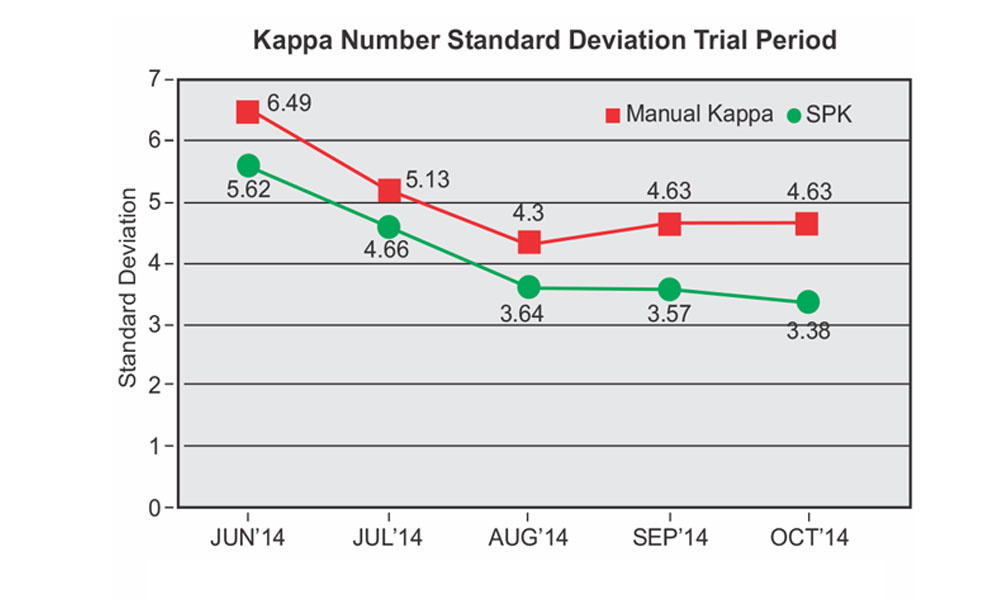
the sigma values averaged 2.63 – more than 50% reduction from the trial start.
Lee says: “The operators are making fewer and smaller changes to the liquor to wood ratios and that means more consistent pulp for the machines.” A Green Bay Packaging report shows that liquor to wood ratio changes were reduced from 84/month to 44/month. “Variability in the tests was causing us to over-control; now we have cut the changes for better control,” adds Williamson. The board machine operators get a heads-up warning of changes well in advance and the swings are much less. As an indication of operator acceptance, the machine tenders call to see what is wrong if the measurement is offline for half an hour for preventive maintenance. “We call them in advance to get permission to take it offline. That’s how critical it is,” jokes Williamson.
Higher yield, fewer web breaks
During the trial period the average Kappa number was raised about three points; now it is run consistently at a target of 98. In all fairness this increase is not entirely due to the SPK measurement. The mill also invested in wood chipping operations to get more even chip size and more uniform cooking. Williamson has no problem crediting the SPK with one point Kappa increase. In fact he says they could not have made the full three point shift without it. He estimates that a one point increase means $300,000 savings in wood costs and energy savings in the recovery operation since there is less black liquor in the loop with a lower liquor to wood charge.
During the trial the break events on the No.1 linerboard machine were tracked. Forty-one breaks were saved according to an internal report and that resulted in a payback of 8 to 16 months depending on the operating period chosen. No.1 machine was rebuilt with a new press section in 2015 and that in itself would be expected to improve productivity. It is therefore difficult to isolate the effects of the Kappa measurement. However, considering how the operators rely on the measurement to avoid breaks Williamson has no problem extrapolating the initial trial results to today. Lee adds his thoughts on the benefits: “Fewer breaks mean more uptime and more total production. Increased reliability is a major focus going forward and the SPK goes a long way to reducing those breaks from a fiber furnish standpoint.” “The whole mill is sitting on the BTG measurement,” Williamson concludes.
Mark Williamson is a Journalist Engineer who documents technological solutions and customer results. He has 40 years of experience in the pulp and paper industry, 35 of them closely connected to process automation and quality control.